
Better benchmarking makes for energy savings success
The annual reports can help NYC buildings plan for the future while meeting sustainability requirements.
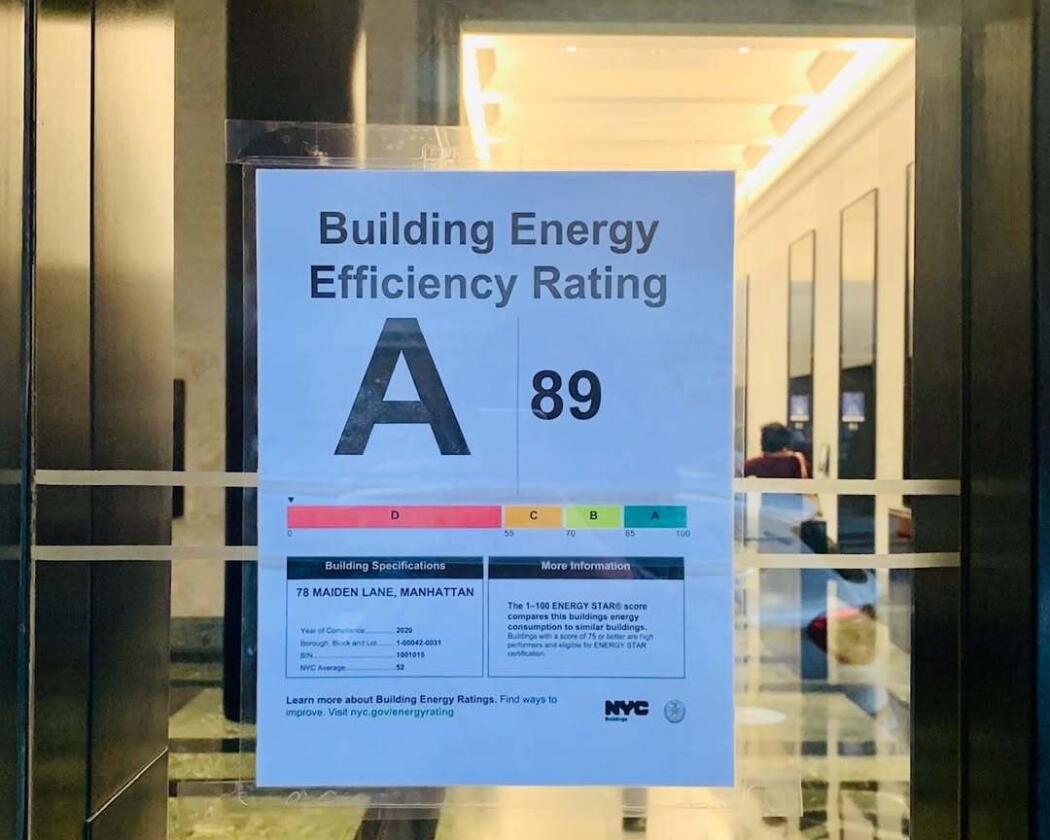
As of 2020 energy efficiency letter grades must be displayed on covered New York City buildings. Photo: Facebook/NYC Buildings
Each year, approximately 50,000 buildings across the city are required to submit a benchmarking report tracking energy and water consumption. For many owners and managers of these buildings, all larger than 25,000 square feet, the annual report can become just a box to check amid dozens of other requirements — but filing it only for compliance’s sake means missing a chance to prepare for future sustainability rules.
Benchmarking data can provide a year-over-year picture of how a building’s usage is changing over time, if at all, and help owners and managers pinpoint areas for improving efficiency and saving money on water and energy costs in the long run. It also helps establish a solid, data-informed knowledge base for making energy efficiency improvements related to Local Law 97(LL97) — With stricter LL97 emissions limits approaching in 2030, benchmarking can help buildings at risk of exceeding them start to identify potential solutions for avoiding fines.
“Benchmarking is your first point of collecting data and analyzing it to be used for other purposes, like capital projects or whatever else needs to be done,” said Roshani Giri, a manager of energy services at EN-POWER Group. “It’s the backbone and basis of everything and anything.”
The benchmarking requirement began with Local Law 84 of 2009, (LL84) which initially required buildings 50,000 square feet and above to file annual energy and water reports. In 2016, Local Law 133 (LL133) expanded the covered buildings list to include those 25,000 square feet and above. Covered buildings must file their reports for each calendar year by May 1 of the following year, or face penalties of $500 per quarter until the report is submitted.
These buildings, commercial and residential alike, make up only about 5 percent of the city’s building stock but produce about 40 percent of its greenhouse gas emissions, according to Urban Green Council. Their data also shows that, since the first reports were filed in 2010, emissions from large buildings have fallen 26 percent, thanks to more efficient energy use, cleaner fuel upgrades and improvements to the city’s district steam heat system.
Benchmarking data also feeds the energy grades that covered buildings must post near their public entrances. Each building gets a letter grade from A to D based on its Energy Star score, which is calculated by comparing its energy and water use with that of similar buildings in similar climates across the country. Because the grades are public, more owners and managers are paying attention to how a low one looks.
“There are people who will care if they fall from A to B,” Giri said.
So, if a building’s efficiency score is falling or the building used significantly more energy this year, what’s the first step to using benchmarking data to help make improvements?
Energy experts first recommend going back to previous years of benchmarking data. Most buildings, if they aren’t newly constructed, should have at least about a decade’s worth of benchmarking to compare new data to. Putting one year in the larger context of the building’s performance history can help owners identify what is normal, what isn’t, and identify trends.
A spike in heating energy after a bitterly cold winter, for example, might suggest the heating system needs major work. But putting the data point in the context of the last eight years, rather than just the previous one, can show how the system is actually performing after taking the weather into account. Occupancy changes might also skew the numbers, which is why it is important to take all external factors into account before making big decisions based on benchmarking data.
Several years of data can also help building owners determine when a trend might merit closer attention. After accounting for occupancy, weather and other outside factors, owners can see if their baseline usage is increasing year over year, which may indicate that systems need to be tuned up or parts need to be replaced. And after those first-line fixes, if baselines continue increasing, it might be time to consider larger solutions.
Without that data, an owner or manager might be led astray in how they prioritize which building projects get done when; fixing the loudest complaint, for example, or the most familiar project, or whatever worked at another building. Benchmarking data lets them step back and see whether an anomaly needs a closer look or a trend calls for a broader assessment of the building’s systems.
“Those data points over time [are] what tells the story and helps us start the conversation,” said Bennett Courrier, another manager of energy services at EN-POWER. “The data is never going to tell us exactly what to do with a building, but it’s a really good starting off point.”
Owners and managers can use benchmarking data to plan next steps that align with their goals. An initial conversation with building staff might reveal more about how systems are currently operating, and where there might be room for optimization based on what the data suggests. Owners with multiple properties can also compare their buildings to decide which ones need attention first. And after making a fix, owners can use benchmarking data to track if it’s working. If benchmarking data show that, for instance, switching a boiler fuel source or installing low-flow showerheads in apartments is not making a significant difference, it could indicate something larger going on that would benefit from a professional eye.
The Building Performance Lab at CUNY is home to the NYC Sustainability Help Center, which helps building owners and managers understand and comply with the city’s sustainability requirements for free. Originally started in 2009, the center illustrates how benchmarking data fits into the rest of the city’s local laws and can assist building owners with taking the next steps towards compliance based on benchmarking data.
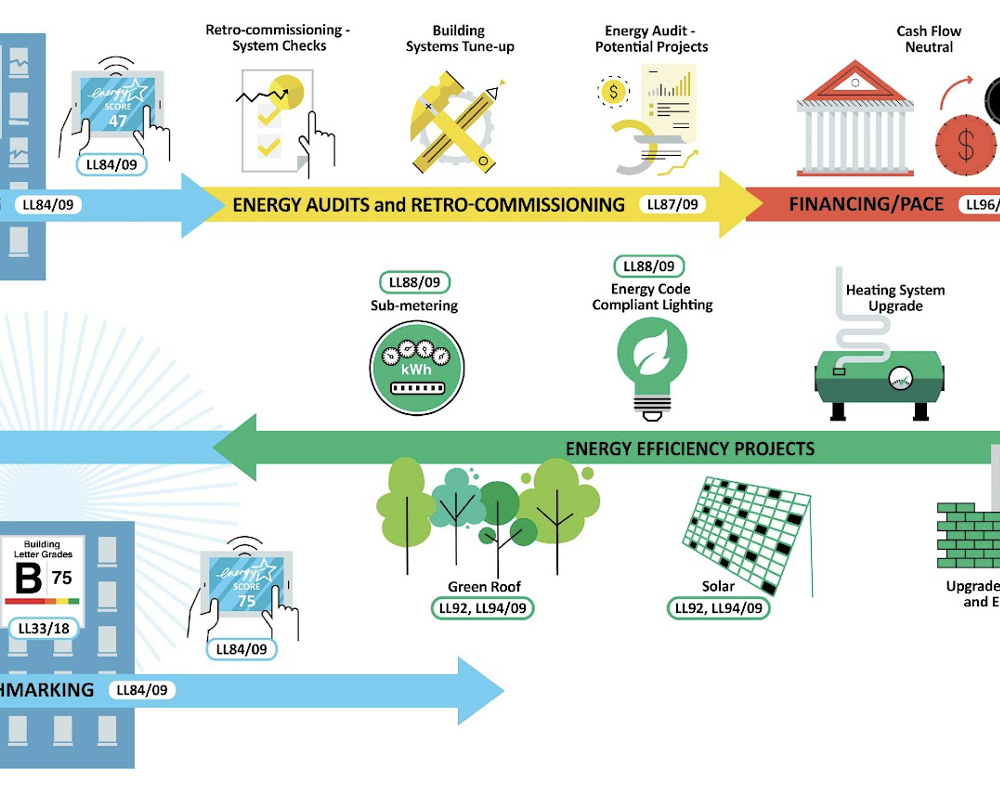
Photo courtesy of NYC Sustainability Help Center
“We put a lot of emphasis on data accuracy because in addition to the building’s energy consumption, the property use details and gross floor area are important factors that go into calculating the score for the building,” said Lillibeth Liriano, the center’s program director. “With the introduction of LL33 energy grades and LL97 greenhouse gas emissions reporting, there is much more emphasis put on ensuring accurate benchmarking data reporting, as that data feeds directly into the energy grade assignments and the emissions calculations.”
In addition to using Energy Star Portfolio Manager to review building data, Liriano recommended owners use Momentum, a platform developed by Cadence OneFive and facilitated through the NYC Accelerator. She said the platform uses benchmarking data to help building owners and managers understand where they sit in relation to local law compliance and connect them to planning resources. The platform can also keep track of incentives and progress.
An engineering study, energy audit or other report can also help buildings plan major projects ahead of upcoming requirements and, just as important, figure out how to pay for them.
“What we’re discussing now is how to make folks aware and start these conversations to say, don’t wait until 2030, or even 2029 — because at that point it’s too late,” Courrier said. “What you do starting January 1, 2029 will impact what happens to your 2030 emissions.”